When you fill a prescription for a generic drug, you’re not just saving money-you’re helping the whole healthcare system work better. But how do we know which generics actually deliver the best value? That’s where cost-effectiveness analysis comes in. It’s not about which drug is cheapest at the pharmacy counter. It’s about which one gives you the most health for every dollar spent.
What cost-effectiveness analysis really measures
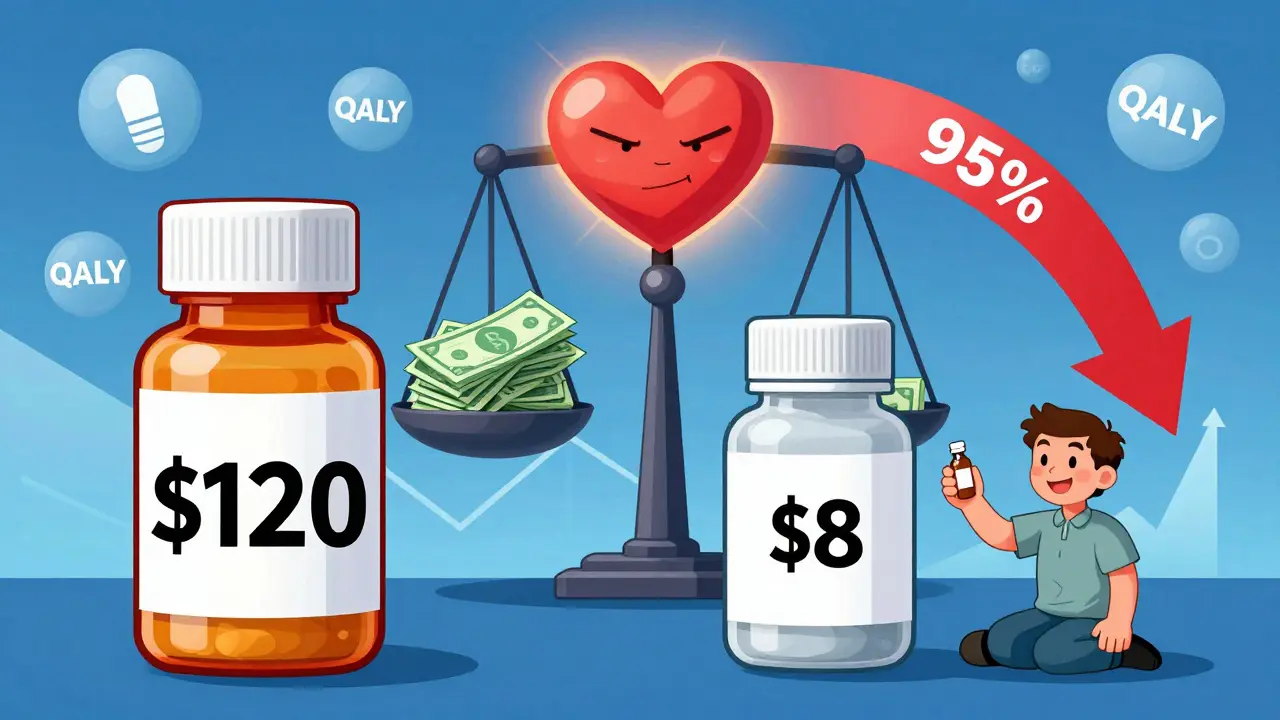
Cost-effectiveness analysis (CEA) looks at two things: how much a treatment costs and how much better it makes people feel or live. The standard unit for measuring health improvement is the quality-adjusted life year, or QALY. One QALY equals one year of perfect health. If a drug helps someone live an extra year with chronic pain, it might count as 0.6 QALYs. If it helps them live pain-free, it’s 1 QALY. For generics, CEA compares the price of one generic version to another-or to the brand-name drug-and sees which one gives the best health outcome per dollar. It’s not about whether the drug works. All approved generics are clinically the same. It’s about whether you’re paying too much for the same medicine. The numbers tell a clear story. When the first generic enters the market, the brand-name drug’s price drops by about 39%. When six or more generics are available, prices fall more than 95% below the original brand. That’s not a coincidence. It’s market competition at work.Why some generics cost 15 times more than others
Here’s the surprising part: not all generics are created equal in price-even when they’re the same drug. A 2022 study in JAMA Network Open looked at the top 1,000 generic drugs in use and found something shocking. Some generics were 15.6 times more expensive than other drugs in the same therapeutic class that did the exact same job. For example, one generic version of a blood pressure medication cost $120 for a 30-day supply. Another generic, with the same active ingredient and dosage, cost just $8. Both worked equally well. The difference? One was a branded generic-marketed with fancy packaging and a well-known name-even though it was chemically identical to the cheaper version. The study found 45 such high-cost generics that had cheaper alternatives. If all patients switched, total spending on those drugs would have dropped from $7.5 million to under $900,000. That’s an 88% savings. Why does this happen? Because Pharmacy Benefit Managers (PBMs) often profit from the gap between what they pay pharmacies and what insurers pay them. They call it “spread pricing.” If a PBM gets paid $100 for a drug but only pays the pharmacy $60, they pocket $40. That’s a big incentive to keep expensive generics on formularies-even when cheaper ones exist.How pricing data shapes the analysis
To do a real cost-effectiveness analysis, you need accurate pricing data. But here’s the problem: many studies use outdated numbers. The Federal Supply Schedule (FSS), Veterans Affairs (VA) pricing, and Average Wholesale Price (AWP) are common sources-but they’re not always reliable. For brand-name drugs, FSS pricing is marked up by 121%, VA by 152%, and AWP by 64%. For generics? AWP is only marked up by 27%. That means if you use AWP to estimate generic costs, you’re already underestimating their true value. The NIH found that with two generic competitors, prices drop 54% below the original brand. With four, it’s 79%. But most cost-effectiveness studies ignore this trend. A 2021 ISPOR conference report showed 94% of published analyses didn’t even try to predict future generic price drops. That’s like betting on a stock price without considering when the company will release a new product.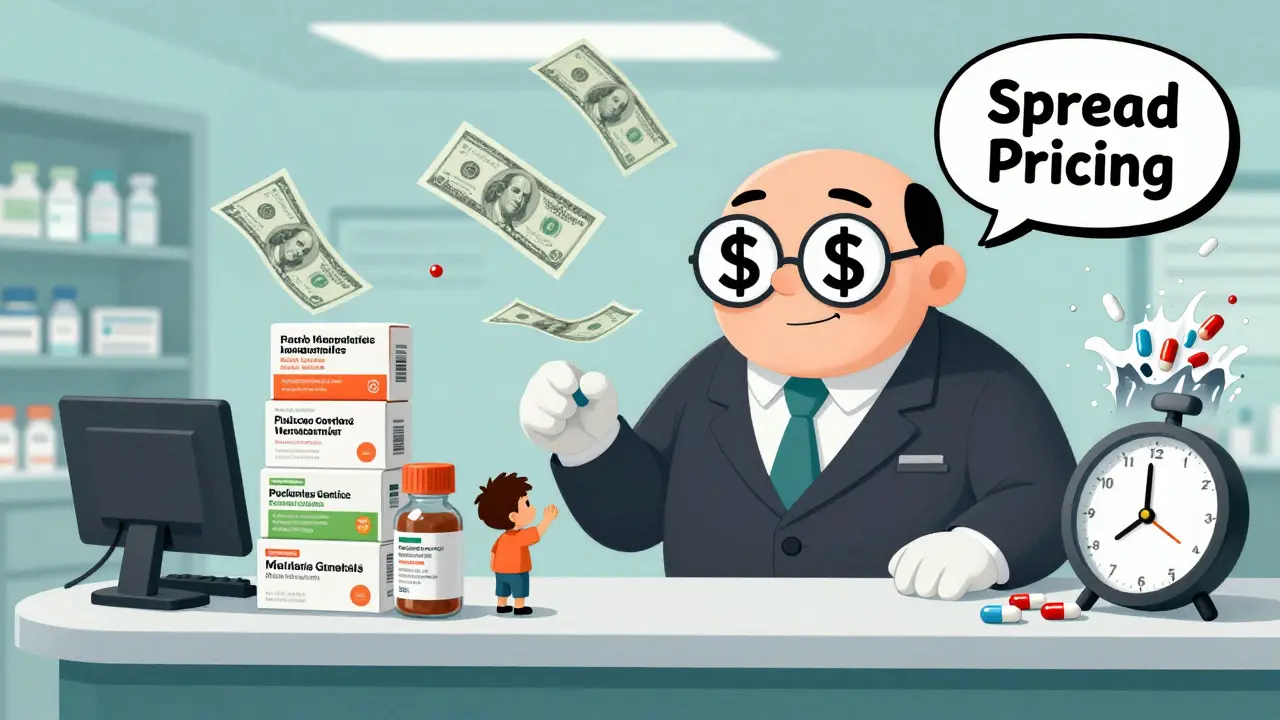
The hidden bias in drug pricing models
There’s another layer to this. Studies funded by drug companies are more likely to say their own drugs are cost-effective. A 2000 review in Health Affairs found industry-funded studies reported better results than independent ones. Why? Because they use the brand-name drug as the only comparison-not the cheaper generic alternatives. That’s a big deal. If your analysis says a drug is cost-effective compared to another expensive drug, but ignores the $5 version that works just as well, you’re not measuring value-you’re justifying high prices. Experts like Dr. John Garrison warn that failing to account for patent expiration creates “pricing anomalies.” If you model a drug’s cost-effectiveness without factoring in that generics will hit the market in 18 months, you’re making the drug look more expensive than it will actually be. That can block access to a life-saving drug just because the model doesn’t see the future.Therapeutic substitution: the easiest savings opportunity
Sometimes, the best cost-saving move isn’t switching to a cheaper version of the same drug-it’s switching to a different drug in the same class. This is called therapeutic substitution. The JAMA study showed that when doctors swapped a high-cost generic for a lower-cost drug in the same therapeutic category, savings jumped to 20.6 times the price difference. For example, switching from one statin to another-both equally effective for lowering cholesterol-could cut costs by over 80%. But this doesn’t happen often. Many formularies still lock in specific brands-even generics-because of contracts with manufacturers or inertia in prescribing habits. Clinicians need better tools to know which alternatives are truly equivalent and cheaper.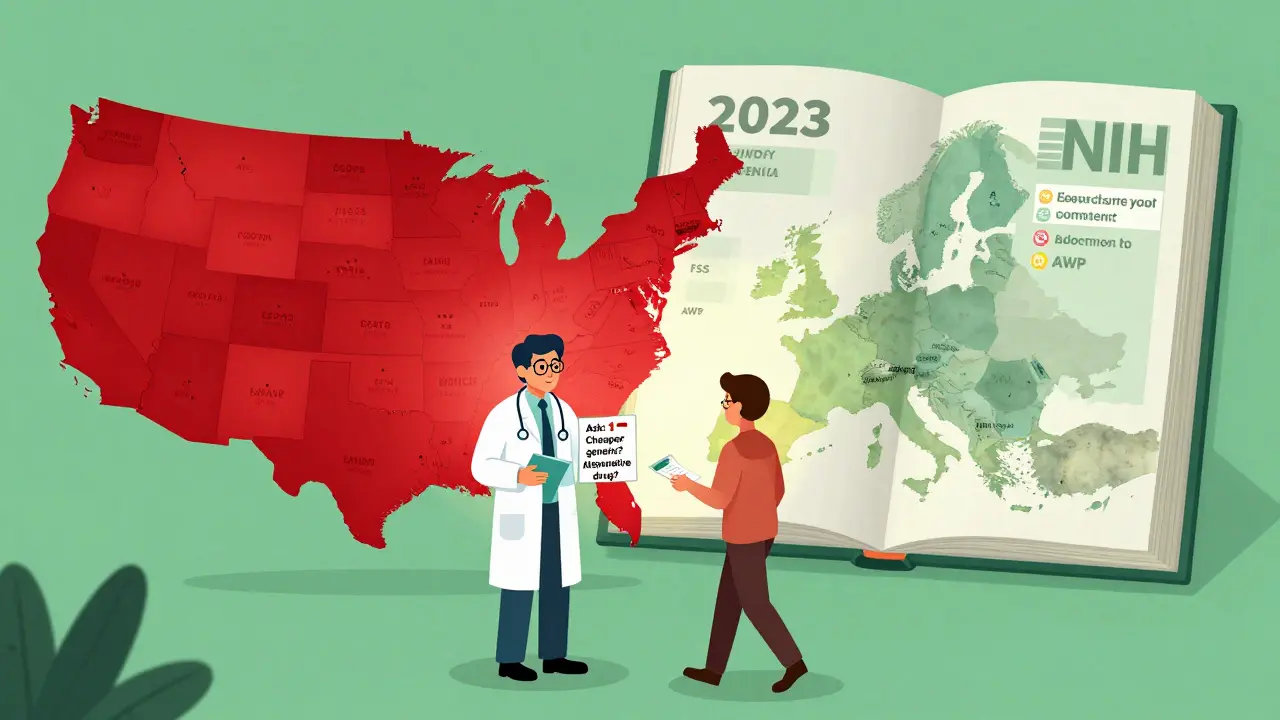
Why the U.S. lags behind Europe
In Europe, over 90% of health technology assessment agencies use formal cost-effectiveness analysis to decide which drugs to cover. In the U.S., only 35% of commercial insurers do. Medicare and Medicaid have some rules, but they’re inconsistent. Why? Because the U.S. system is fragmented. Private insurers, PBMs, hospitals, and pharmacies all have different incentives. In Europe, single-payer systems can negotiate prices across the board. In the U.S., it’s a free-for-all. The result? The U.S. spends more on prescription drugs than any other country. Yet generics make up 90% of prescriptions. That means we’re getting the volume right-but not the pricing.What’s changing-and what’s next
New laws are pushing change. The 2022 Inflation Reduction Act lets Medicare negotiate drug prices, and it includes provisions that encourage generic substitution. The 2020 Drug Pricing Reduction Act also targets Medicare Part D. More importantly, the NIH released a new framework in 2023 that says cost-effectiveness models must now account for future generic entry. It’s a small but critical shift. Instead of assuming prices stay static, analysts now have to model the drop that comes with patent cliffs. The numbers are clear: over 300 small-molecule drugs lost patent protection between 2020 and 2025. That’s a wave of generics coming. If we don’t update how we measure value, we’ll keep overpaying-millions of times over.What patients and providers can do
You don’t need to be an economist to use this knowledge. If you’re prescribed a generic drug, ask:- Is there a cheaper version of the same drug?
- Is there a different drug in the same class that works just as well and costs less?
- Is my insurer pushing me toward a higher-priced option because of how they’re paid?
What is cost-effectiveness analysis for generic drugs?
Cost-effectiveness analysis (CEA) for generic drugs compares the price of different generic options (or generics versus brand-name drugs) to the health benefits they provide. It uses metrics like quality-adjusted life years (QALYs) to determine which drug delivers the most health improvement per dollar spent. The goal is to identify the most efficient choice-not necessarily the cheapest, but the one that gives the best value.
Why do some generic drugs cost so much more than others?
Even though generics must be chemically identical to brand-name drugs, their prices can vary wildly. Some manufacturers market their version with branding, packaging, or distribution deals that inflate price. Pharmacy Benefit Managers (PBMs) sometimes profit from the gap between what they charge insurers and what they pay pharmacies, creating incentives to keep higher-priced generics on formularies-even when cheaper alternatives exist.
How much money can be saved by switching to lower-cost generics?
A 2022 study found that replacing just 45 high-cost generics with their lower-cost therapeutic alternatives saved nearly $6.6 million in a single dataset-reducing spending from $7.5 million to $873,711. Across the U.S. healthcare system, generic drugs saved $1.7 trillion between 2007 and 2017. When six or more generics enter the market, prices drop over 95% below the original brand price.
Why don’t all insurers use cost-effectiveness analysis?
Many U.S. insurers don’t use formal CEA because of fragmented systems, lack of standardized data, and influence from Pharmacy Benefit Managers who profit from price spreads. In contrast, European health agencies use CEA in over 90% of coverage decisions. The U.S. system prioritizes contracts and rebates over value-based pricing, making it harder to adopt consistent, evidence-based approaches.
Can cost-effectiveness analysis be biased?
Yes. Studies funded by drug manufacturers are more likely to conclude their own drugs are cost-effective, especially when they compare against other expensive drugs instead of cheaper generics. Also, many analyses ignore future generic entry, which artificially inflates the cost of a drug and makes it look less cost-effective than it will be once generics hit the market. The best analyses account for patent cliffs and real-world pricing trends.
What should patients ask their doctor or pharmacist about generics?
Patients should ask: “Is there a cheaper version of this generic?” and “Is there another drug in the same class that works just as well but costs less?” Pharmacists often know the real price differences between manufacturers. Don’t assume your prescription is the cheapest option-ask for alternatives. A simple switch can save hundreds per year.


Pat Fur
24 March / 2026So many people think generics are all the same, but this breakdown? Eye-opening. I had no idea PBMs profit off the gap like that. I asked my pharmacist last week why my blood pressure med was $40 when my friend paid $6 for the same thing. She just sighed and said, "It's the system."
Now I get it.